Amplifiers
Amplifiers are used to increase the voltage or power amplitude of signals. They have many applications.
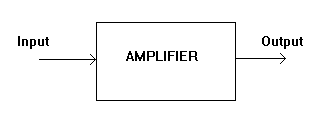
AUDIO VOLTAGE amplifiers
boost the amplitude of
signals between the
frequency range 20 Hz to
20 KHz. This is the
range of human hearing.
They are often used as
PRE-AMPLIFIERS before
the main amplifier.
AUDIO POWER amplifiers provide the power necessary to drive loudspeakers. They also amplify a frequency range from 20Hz to 20 KHz.
Circuit Symbols Tutorial
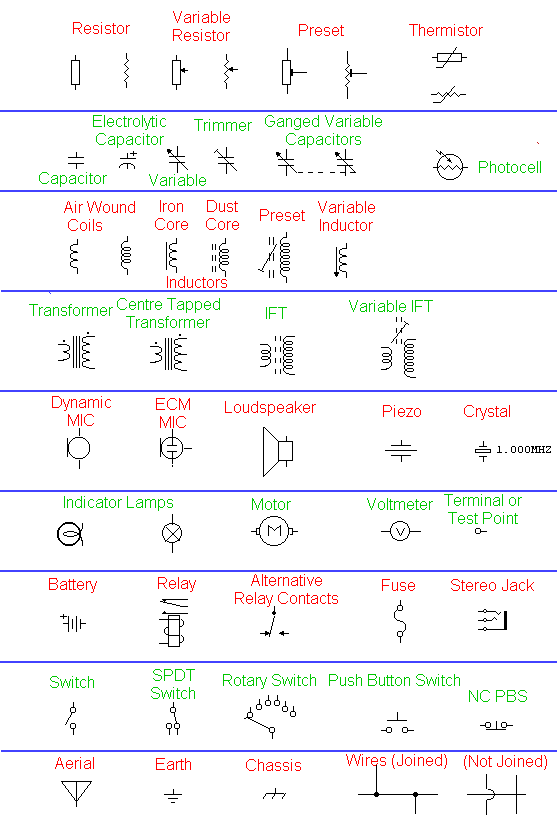
The diagram below shows passive components, resistors, capacitors and inductors, and also electrical components such as switches, relays, motors and lamps. Also shown are the symbols for wires that are not joined ( no physical electrical connection ) and wires that are joined ( a physical electrical connection ).
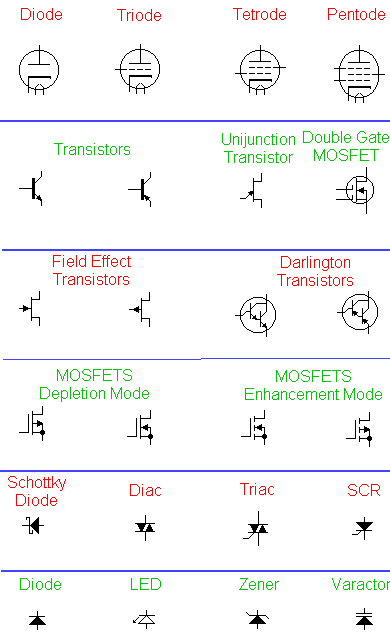
This next diagram depicts active components, the difference between active and passive is that active components require a power source to work, whereas passive components do not. The top symbols represent vacuum tube or thermionic devices. Although at one time, these were being replaced by the smaller transistor and integrated circuits, they are finding their way back into electronics for use in professional audio equipment and some radio receivers
Filters Tutorial
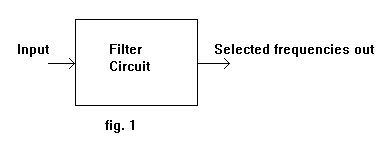
A filter circuit is like a sieve. It allows some things through and holds back others. In this case we are talking about AC frequencies. Some frequencies pass through the filter while others are rejected.

VOLTAGE OUT is plotted against FREQUENCY.
Figure 2 shows a LOW PASS filter response curve giving output at low frequencies but none at higher frequencies.
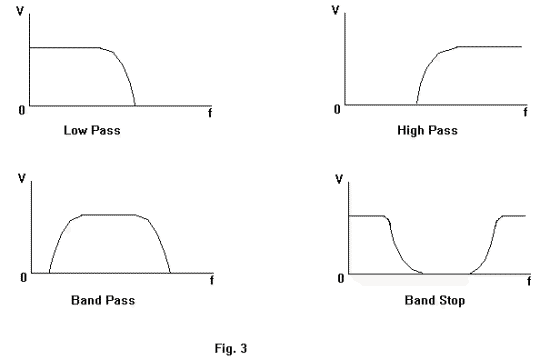
Figure 3 shows a selection of filter characteristics.
Simple filters can be made from capacitors and resistors


In audio frequency amplifiers, CROSSOVER filters to direct low frequencies to the WOOFER and high frequencies to the TWEETER speakers.
In SCRATCH filters to remove unwanted high frequency noise.
In NOTCH filters to remove whistles due to two radio stations being too close together in frequency.
In Hum filters to remove low frequency noise due to the mains supply.
RMS and Peak to Peak
If someone measures the value of the AC voltage coming out of a transformer using an oscilloscope and says it is 20 volts peak to peak and we use a voltmeter to confirm this we will find that the meter reads only 7.07 volts.
This is because the scope measures peak to peak values and the meter measures RMS values.
In figure 1 the 'scope displays the peak value. The peak to peak voltage is twice this. For example if the peak is 10 volts then the peak to peak is 20 volts.
When using a meter to measure the same AC voltage a different value is obtained. This is because, as we said, meters measure RMS values.
A Root Mean Square (RMS) voltage gives the same heating effect as a DC voltage of the same value. See figures 2 and 3. Both thermometers show the same temperature when the resistors are heated by the current passing through them.
RMS values can be converted to peak to peak values and vice-versa.
RMS values times 1.414 equals the Peak value. Peak to Peak is twice this. 7.07 volts RMS times 1.414 and then doubled is 20 volts, the Peak to Peak value.

Peak values times 0.707
gives the RMS value.
Don't forget that Peak
is half the Peak to
Peak.
20 volts Peak to Peak is
10 volts Peak. 10 volts
Peak times 0.707 equals
7.07 volts RMS.
Feedback Tutorial
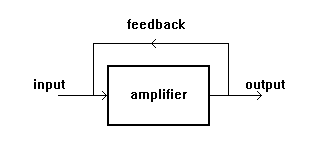
It is best if you read the page on the PHASE first.Feedback is when some of the output signal from a circuit is fed back to the input and combined with the input signal.
If input and output signals are in phase then the feedback is POSITIVE.
If the two signals are out of phase then it is NEGATIVE FEEDBACK.
Positive feedback in an
amplifier increases the
gain and reduces the
bandwidth of the
amplifier.
If there is sufficient
positive feedback then
the amplifier will
oscillate.
If a microphone is too
near to a loudspeaker
then you will get
positive feedback
causing "howl round".
Negative feedback reduces gain and increases bandwidth.
Oscillators
Oscillators are amplifiers with such a large amount of positive feedback that they produces an output signal with no signal applied to the input.

The output amplitude is determined by the gain of the amplifier and the feedback circuit.
Oscillators can produce
sine waves, the
frequency of which is
determined by TUNED
CIRCUITS.
Tuned circuits consist
of a capacitor and
inductance.
Square wave oscillators use resistors and capacitors to determine the frequency of oscillation.
Ideally the frequency of
an oscillator should be
stable, but due to
temperature variations
and mechanical vibration
this may not be so.
Precautions are taken
against frequency DRIFT.
Circuit Diagrams Tutorial
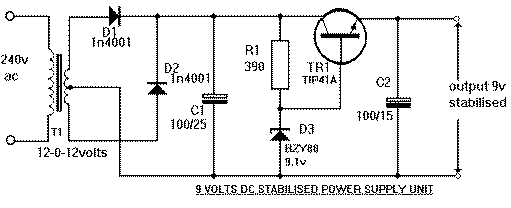
Circuit diagrams are one method of describing electronic equipment.They are made up of BS3939 standard circuit symbols.

READING a circuit
diagram is the ability
to look at the diagram
and understand how the
circuitry works.
Be aware that the layout
of the circuit diagram
may be nothing like the
physical layout of the
actual equipment.
Although the circuit
diagram shows all
capacitors the same size
and shape, in reality
they will be of assorted
sizes, shapes and color.
This applies to other
components.
Amplitude Modulation
If you connect a long wire to the output terminals of your Hi-Fi amplifier and another long wire to the input of another amplifier, you can transmit music over a short distance. DON'T try this. You could blow up your amplifier.
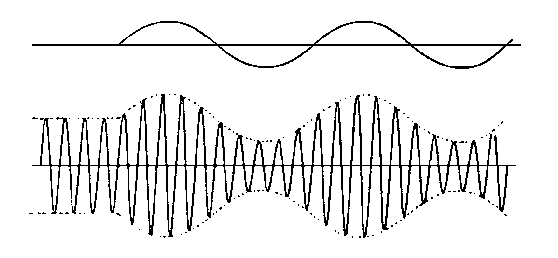
A radio wave can be transmitted long distances. To get our audio signal to travel long distances we piggyback it onto a radio wave. This process is called MODULATION.
The radio wave is called the CARRIER.
The audio signal is called the MODULATION.
At the receiving end the audio is recovered by a process called DEMODULATION.
From the diagram below, it can be seen that when the carrier is modulated, its amplitude goes above and below its unmodulated amplitude.
It is about 50%
modulated in the
diagram.
The maximum percentage
modulation possible is
100%.
Going above this causes
distortion.

Most broadcasters limit
modulation to 80%.
Modulating the carrier
frequency with an audio
frequency produces two
new frequencies.
At this point it would
be a good idea to read
the page on MIXERS.
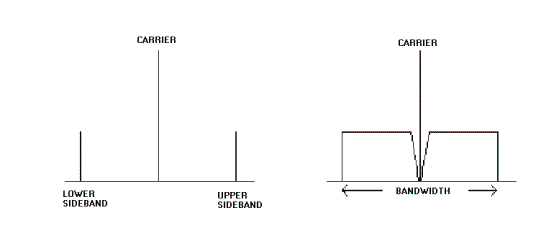
These new frequencies
are called the upper and
lower SIDEBANDS.
The upper sideband is
the carrier frequency
plus the audio
frequency.
The lower side band is
the carrier frequency
minus the audio
frequency.
If you tune across a
station in the Medium
Wave Band you will find
that it takes up space
in the band.
This is called the
signal BANDWIDTH.
This is the space taken
by the upper and lower
sidebands.
In the the example given
above it would be 40
KHz.
Since the Medium Wave is
only 500 KHZ wide there
would only be space for
about 12 stations.
Therefore the bandwidth
of stations is limited
to 9 KHz, which limits
the audio quality.
If there are two stations too close together, their sidebands mix and produce HETERODYNE whistles.
Since both sidebands
carry the same
information, one side
can be removed to save
bandwidth.
This is SSB, single
sideband transmission.